Trends & Explicitness in Spotify Songs (EDA + Modeling)
by L. Mark Coty
Exploring 237k Spotify tracks to see how music—and explicitness—have changed over time.Quick overview of conclusions (more detail below):
Energy ↔ Loudness strong
Danceability peaks near 120 BPM.
RF ≈ 0.86 accuracy
Increasing Explicitness over Time
GitHub repository here. Run the notebook.
Purpose:As the parent of children who are full-fledged members of what one might call "the Spotify generation," I was intrigued when I encountered this recent dataset containing a wide range of characteristics of about 237K songs on that platform.Upon closer inspection, there seemed to be enough data to ask and possibly answer such questions as:1. How have some of the core features of music changed over time?2. How has the likelihood that a song contains explicit lyrics changed over time?Finally, I thought the "Spotifiers" themselves might be as interested in the answers to these questions as I was.
Overview:I began with a dataset containing information about approximately 237,000 Spotify songs, ranging in date from 1903 to 2024. I performed exploratory data analysis, including a careful examination of the 6 object and 12 numerical columns. I created visualizations of these results, and then moved on to look at relationships between features that appeared to have interesting or meaningful correlations.I also used several classifiers to predict the binary categorical variable "Explicit" (yes/no), and I used some hypothesis tests to examine the relationships between several key variables.My conclusions are below.The GitHub repository containing all of the work can be found here.
The Content and Nature of the Data:
The columns in the dataset and their types are as follows:
Artist : object
Song : object
Emotion : object
Variance : float64
Genre : object
Date : int64
Key : object
Tempo : int64
Loudness : float64
Explicit : object
Popularity : int64
Energy : int64
Danceability : int64
Positiveness : int64
Speechiness : int64
Liveness : int64
Acousticness : int64
Instrumentalness : int64
Explanation of non-obvious columns and values:Variance: Variability measure across audio features of the song
Tempo: Tempo in BPM
Loudness: Average volume level in decibels (usually negative)
The columns from Popularity to Instrumentalness are scored on a 0-100 scale.
The number of unique values in each column are as follows:Data Type: object
-----------------
Artist: 30607 unique values
Song: 159730 unique values
Emotion: 10 unique values
Genre: 2562 unique values
Key: 24 unique values
Explicit: 2 unique valuesData Type: float64
------------------
Variance: 38455 unique values
Loudness: 2953 unique valuesData Type: int64
----------------
Date: 93 unique values
Tempo: 167 unique values
Popularity: 100 unique values
Energy: 101 unique values
Danceability: 94 unique values
Positiveness: 100 unique values
Speechiness: 96 unique values
Liveness: 100 unique values
Acousticness: 101 unique values
Instrumentalness: 101 unique values
To Visualize the Categorical ("object") Data, We Can Examine Their Bar Graphs:
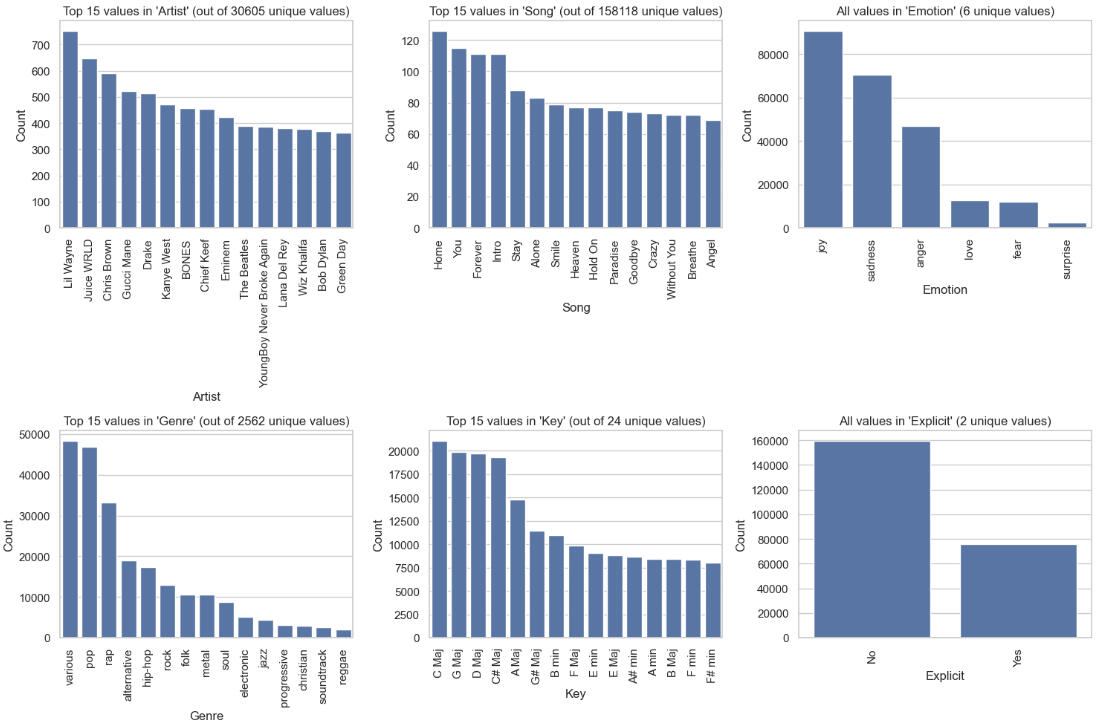
Perhaps the most noteworthy point here is that we have one binary variable, Explicit; two variables with just a handful of unique values, Emotion and Key; and three other variables with many thousands of unique values.
To check whether there are any interesting correlations between 'Emotion' and 'Key', the following crosstab visualization was created:
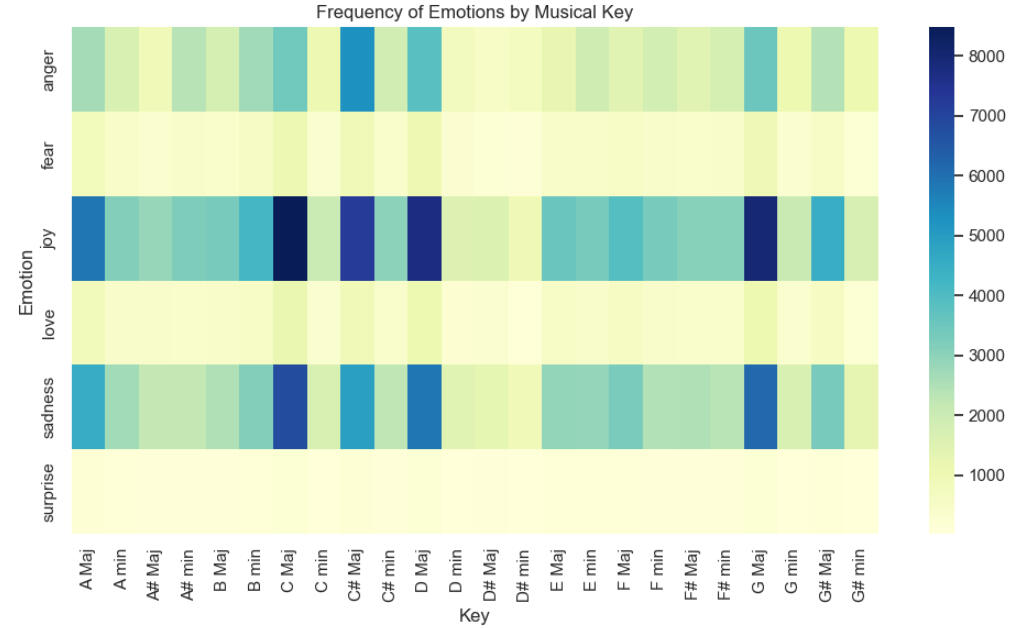
C Maj seems to correlate well with both Joy and Sadness, while C# Maj correlates well with Joy.Also, D Maj and G Maj correlate well with Joy. The association of the major chords with Joy is certainly not surprising, but the connection between C Major and Sadness might be unexpected.
Another question that suggests itself is, "Is there a relationship between Emotion and Explicitness?" Let's check the visualization:

Not unexpectedly, songs classified as expressing Joy or Sadness show a high likelihood to be non-explicit. More surprising is the fact that songs expressing Anger and Joy have equal likelihoods of being explicit.
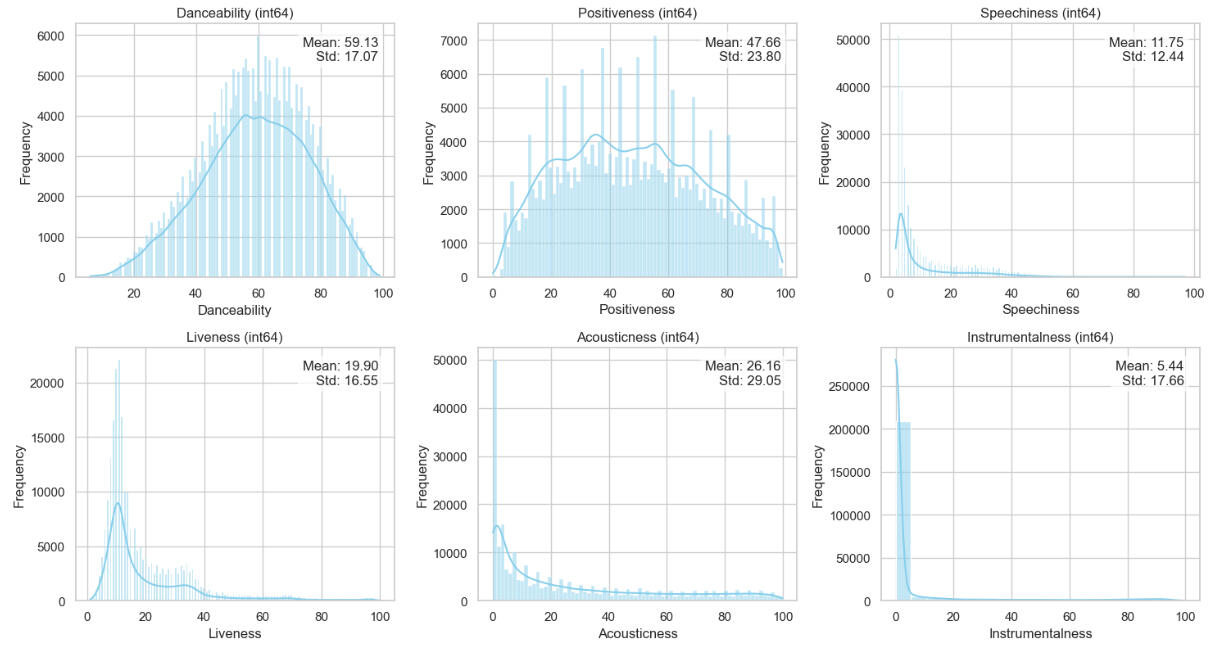
Turning to the numerical columns, we first created histograms for them. Each histogram shows the trend line, the mean, and the standard deviation of the column.
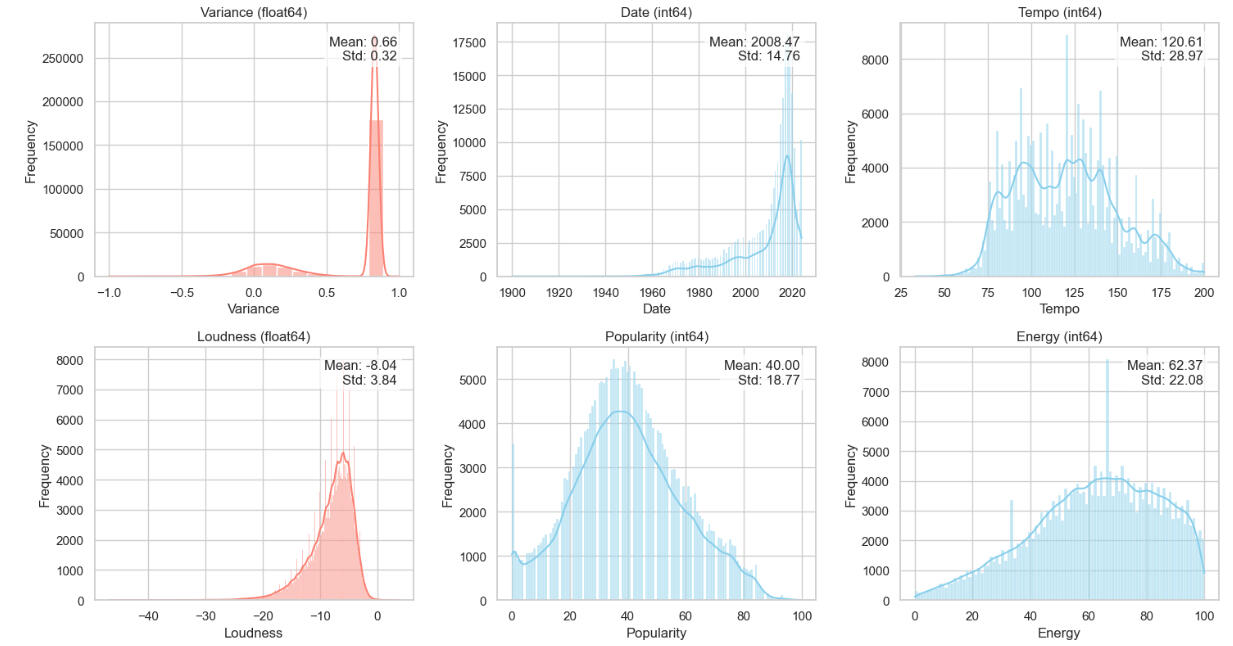
A few observations on the above:* The mean Date of the songs is 2008, with a left-skew distribution.
* Tempo is roughly bi-modal, with a mean of 121, the "disco" tempo.
* Popularity is not far from bell-shaped, except for the slight surge of very unpopular songs.
* Energy has a very interesting shape, left-skewed but nearly following the "3 standard deviation" rule.
An observation on the 'Instrumentalness' histogram:The extreme skewness of this column reminds one of the many times members of the "Spotify generation" may be heard to ask, "Where are the words?" -- in extreme wonder at hearing a song that was extremely popular in the past and yet contained not a single vocal.One example that comes to mind is "Green Onions," by Booker T. and the MGs, which reached #3 on Billboard's Hot 100 without the singing of a word.
Let's look at the heatmap of the linear correlations among the numerical columns:
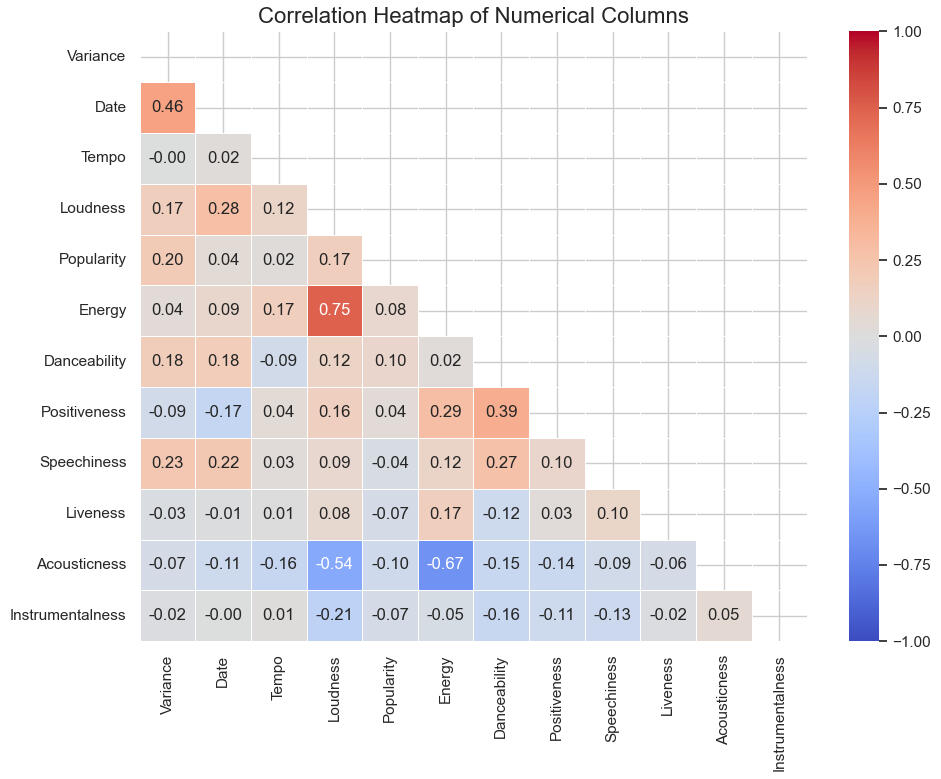
Observations on the heatmap:The strongest positive linear correlations are between Date and Variance, Energy and Loudness,
and Positiveness and Danceability. The latter two pairs seem obvious and to be expected. As for Date and Variance, this may be due to the increase, over time, in the use of devices and "instruments" capable of producing more exotic and previously-unknown variations of sound. The advent of synthesizers and, later, computer-generated music, are examples of these.The strongest negative linear correlations are between Acousticness and Loudness and between Acousticness and Energy, neither of which is surprising.
Let's Plot Popularity Over Date, Shading for Explicitness:
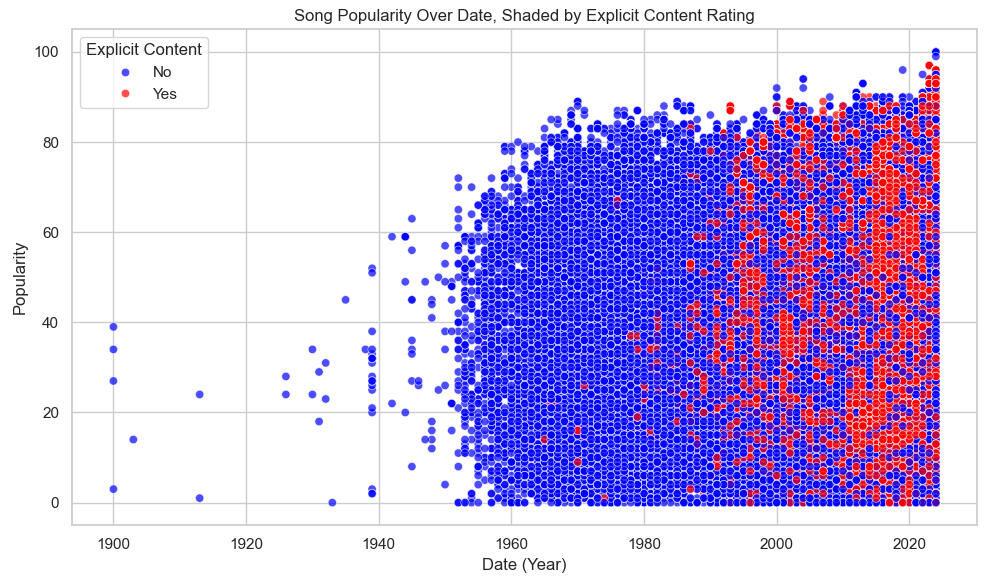
There is no clear correlation between the plotted columns (r = 0.04, see above), but increasing explicitness is clearly visible beginning in the late 1990s.This is an answer to one of our initial questions, regarding the way music has changed over time.
Let's Plot Energy Over Date, Shading for Explicitness:
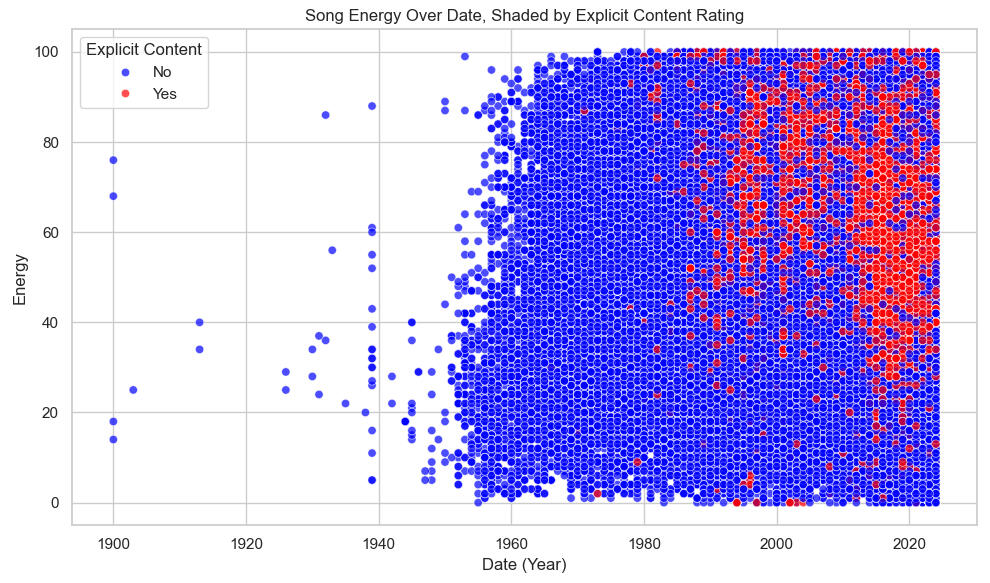
Again, there is no clear linear correlation between the plotted columns (r = 0.09, see above), but increasing explicitness is clearly visible beginning in the late 1990s.Also, note that the explicit songs tend to be higher on the Energy axis. This suggests another relationship which will be examined in what follows.
Plot Energy Over Loudness, Shading for Explicitness:
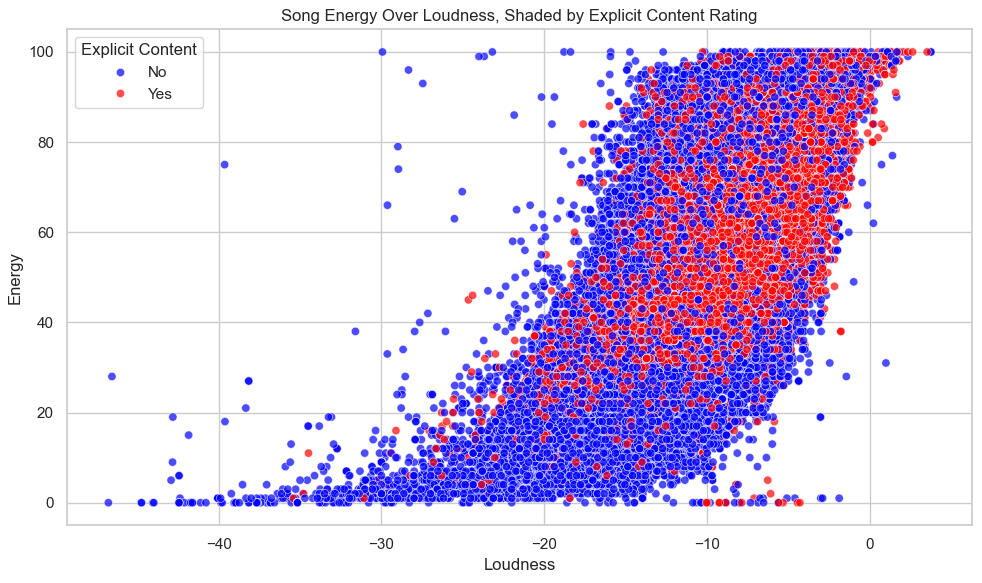
Here we have a clear positive correlation (r = 0.75, see above) and, interestingly, the explicit songs tend to be on the upper-right part of the scatterplot, indicating that they tend to be louder and more energetic. This will also be examined below.
Let's look at a plot of Danceability over Tempo:
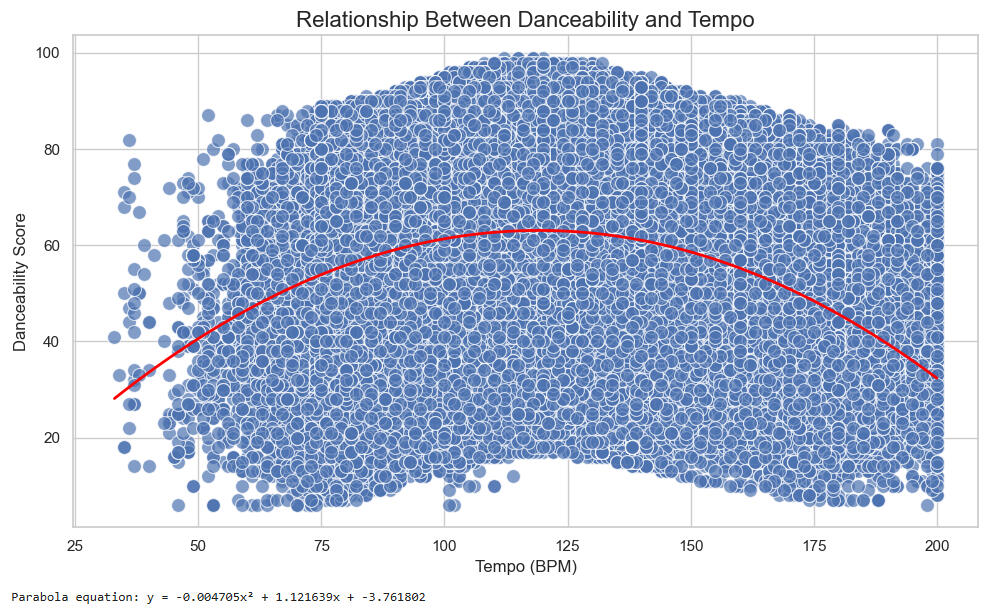
Note that the vertex of the parabolic trend curve occurs at approximately Tempo = x = -1.122/(2*-0.0047) = 19.36.This is very close to the well-known 120 BPM tempo of songs in the disco genre, for example.
Let's look at a plot of Danceability over Energy:
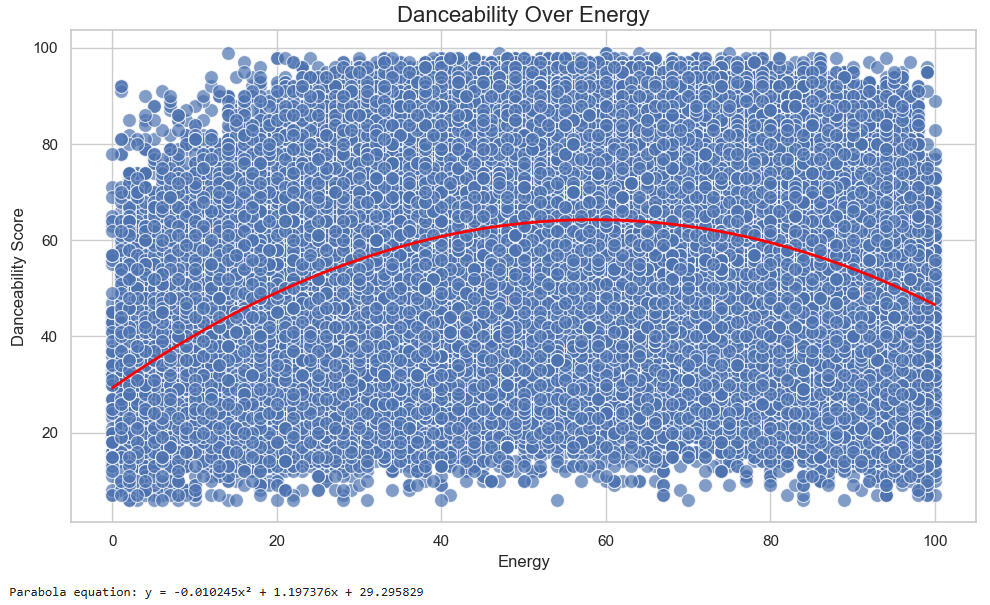
Here, the vertex of the trend curve occurs at Energy = x = -1.197/(2*-0.0102) = 58.7, but the interpretation of this is unclear. It is, though, nearly 60, or half of the 120 BPM mentioned above.
We have examined the relationships among the columns, both categorical and numerical, that seemed promising or significant.One column stands out, though, because it is binary: 'Explicit'.This leads us to ask whether we can predict whether a song is explicit, using various models.So we will look at some classifiers, with 'Explicit' as the target column.We will hold out 20% of the data as a test set in all of the following model constructions.
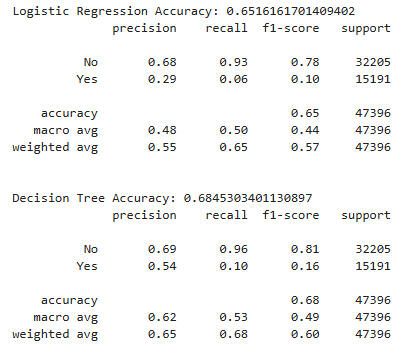
Here we look at Loudness as a predictor of Explicitness using several models. (Note that 1 = explicit and 0 = not explicit.)
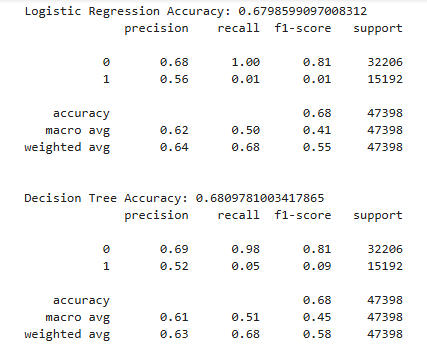
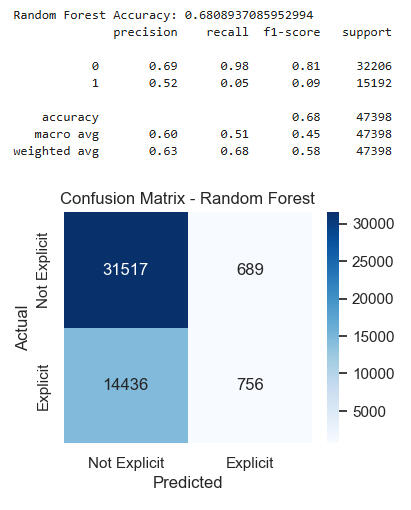
Observations:
1. All three models have accuracies near 0.68.
2. Overall precision, recall, and f1 numbers are nearly identical.
Now we look at Date as a predictor of Explicitness using several models.

The results here are similar, with regression's accuracy falling a bit, while the other two models hold at approximately 0.68.
This is a good place to point out that, according to the value counts presented above, about 65% of the songs in the dataset are not explicit.Thus the 68% accuracy scores that we are seeing here are not much better than would be achieved by simply guessing that a given song was not explicit.
Now we use four features, Date, Loudness, Popularity, and Energy as predictors of Explicitness. This seems like a reasonable place to start, since we have already examined the effect of Date and Loudness, and Popularity and Energy seem like two of the more important features in gauging changing musical forms and tastes. Also, recall that explicit songs tended to be higher on the Energy axis on the scatterplot above.
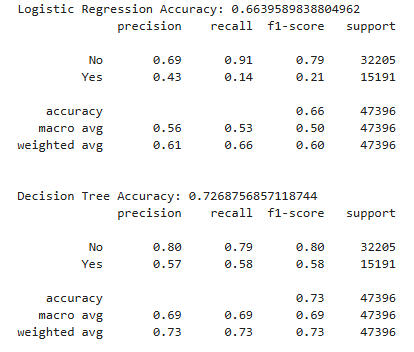

Though the Regression model is only slightly more accurate than it was with Date, and not as high as it was with Loudness, the other two models improve on their previous versions in every respect, with Random Forest rising to 0.77 accuracy, and overall precision, recall, and f1 numbers in the 0.70s for both it and the Decision Tree model. This is noticeably better than the "baseline" of 65% which we could achieve by mere chance.
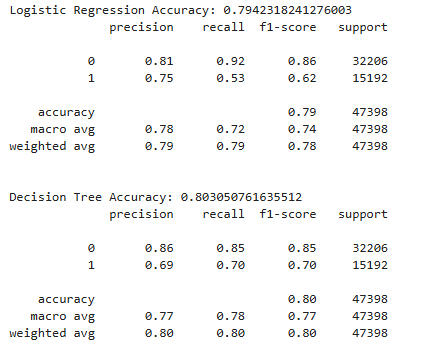
Let's try using more features as predictors of Explicitness. We'll again use Date, Loudness, Popularity, Energy, and add Speechiness.It is reasonable to think that this feature would be a good predictor of the presence of "bad words."Again, we apply our classifiers while holding out 20% of the data for the test set.
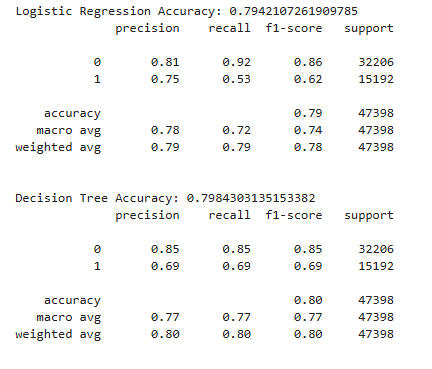
Here we see a very dramatic improvement in all the models, with Random Forest still coming out on top with an accuracy of 85%. Just as importantly, Logistic Regression and Decision Tree improved to 79% and 80%, respectively.
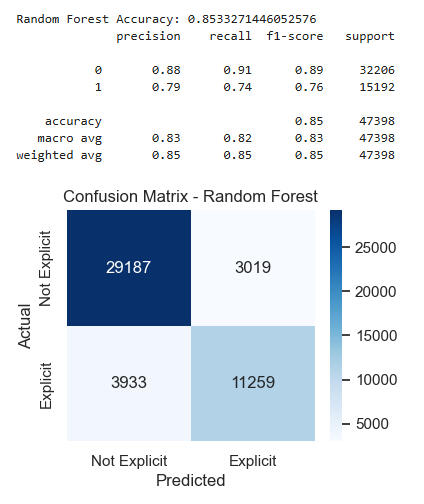
Let's add Tempo to the list of features and see if we get further improvement in our scores.
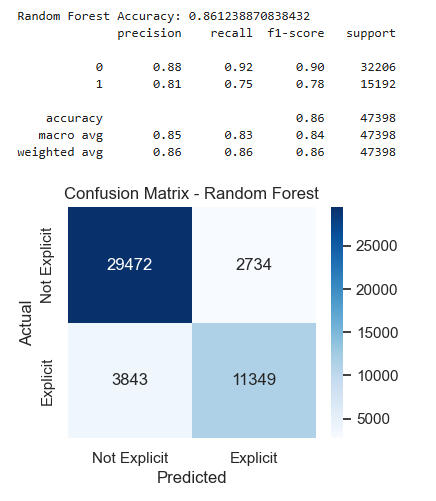
Once again, all the models improved, though not as dramatically as when we added the other features.Regression barely improved -- not until the fifth decimal place! -- but Decision Tree actually broke 80%, and Random Forest hit 86%.What does all this mean? It means that using just a song's loudness, energy, popularity, speechiness, and tempo, we can predict with 86% accuracy whether it contains explicit lyrics.
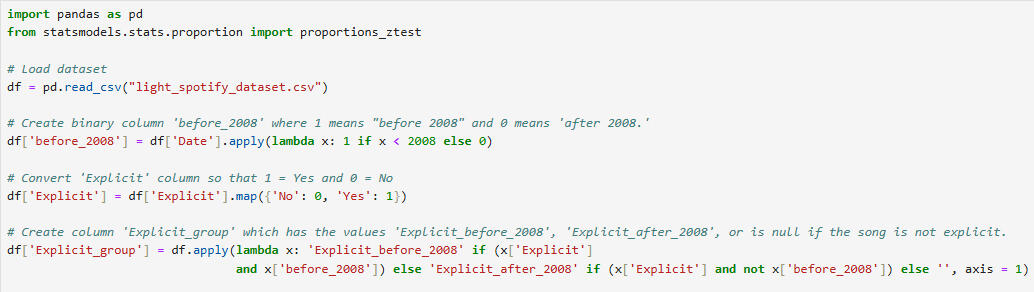
Finally, we performed some hypothesis tests, to get more insight into the dataset.
This is a hypothesis test to see if songs from before 2008 are less likely to be explicit than songs from 2008 or later. 2008 was chosen as the boundary, because it is the approximate mean of the dataset (see above).
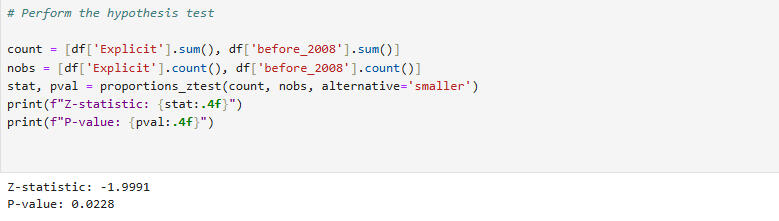
Given the Z-statistic and the P-value, we reject the null hypothesis and conclude that songs from 2008 and after are more likely to be explicit than songs from before 2008. We are 97.72% confident in
this conclusion, since there is only a 2.28% chance we are committing a Type I error.In less technical terms, this means that, for samples of any given size, there is a 97.72% chance that samples from 2008 and later will contain more explicit songs than samples from before 2008.
We now perform a 2-sample T-test to see if songs with higher energy scores have higher popularity scores as well.
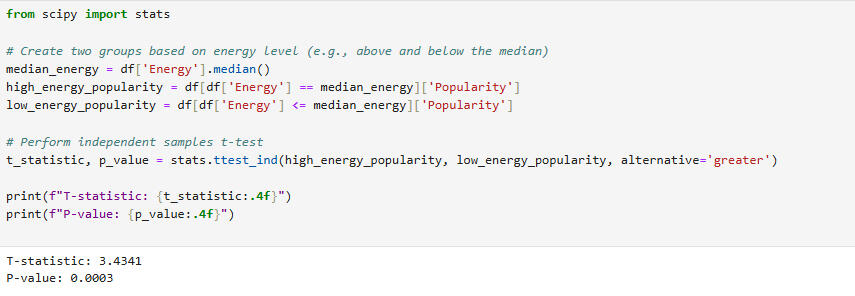
Given the T-statistic and the P-value, we reject the null hypothesis and conclude that songs with higher energy scores also have higher popularity scores. We are 99.97% confident in this conclusion, since there is only a 0.03% chance we are committing a Type I error.
This is a 2-sample T-test to see if songs with higher danceability scores have higher popularity scores as well.
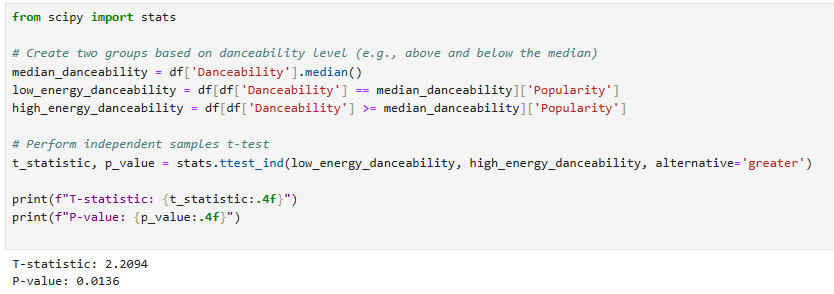
Given the T-statistic and the P-value, we reject the null hypothesis and conclude that songs with higher danceability scores also have higher popularity scores. We are 98.64% confident in this conclusion, since there is only a 1.36% chance we are committing a Type I error.
Conclusions:1. Based on the analysis of the categorical data, we found some connections between Key and Emotion, which is to be expected. we also found some correlations between Mood and Explicitness, one of which -- that between Anger and Explicit -- was also somewhat to be expected.2. Analysis of the numerical data on a column-by-column basis yielded no surprises. We did note the lack of "instrumental" songs in this set, which is made up largely of popular songs from the past 22 years or so, given the mean and standard deviation of the Date column.3. Comparing the numerical data in a heatmap showed only a few pairwise cases of significant linear correlation. However, there were two cases of quadratic correlation shown, between Danceability and Tempo, and Danceability and Energy. The were shown in greater detail by means of scatterplots.4. We found that Loudness and Date were each just fair predictors of the binary categorical variable, Explicit. However, we showed that the four variables, Date/Loudness/Popularity/Energy were much better predictors of explicitness, and that adding Tempo yielded a final high accuracy score of 86%. In all of these cases, the Random Forest classifier performed as well or better than the other classifiers which were applied.5. Finally, three hypothesis tests provided sufficient evidence to conclude that:- Songs from before 2008 are less likely to be explicit than songs from after 2008.- Songs with higher energy scores tend to have higher popularity scores.- Songs with higher danceability scores tend to have higher popularity scores.